Home
Excel 2013 Pivot Tables: Including the "Data Model" (full color): Smart Data Analysis
Loading Inventory...
Barnes and Noble
Excel 2013 Pivot Tables: Including the "Data Model" (full color): Smart Data Analysis
Current price: $34.71
Barnes and Noble
Excel 2013 Pivot Tables: Including the "Data Model" (full color): Smart Data Analysis
Current price: $34.71
Loading Inventory...
Size: OS
*Product Information may vary - to confirm product availability, pricing, and additional information please contact Barnes and Noble
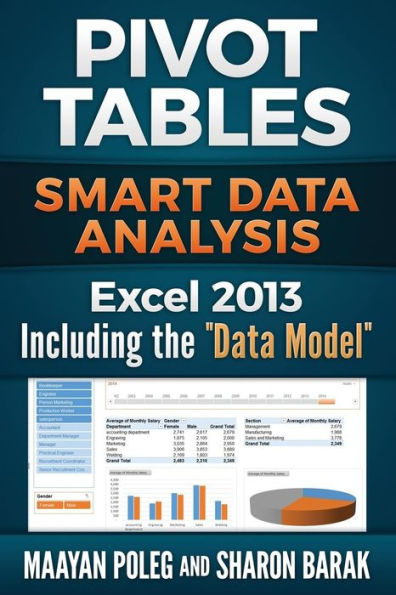
Excel 2013 Pivot TablesIncluding the "Data Model"A pivot table is a simple, yet powerful technique, that enables Excel's users to transform data overload into meaningful and organized knowledge.With pivot tables you can: * See the data in dozens of different ways with a simple mouse drag* Perform fast calculations with no need for formulas* Focus on another part of the data each time and get a clear picture* Show more trends and patterns* Create dozens of reports and charts to analyze your dataWhile reading the book and using the practice files, you will know to:
Create a Pivot Table
oSelect data from the current fileoSelec data from another Excel fileoChange the data sourceoCreate a pivot table based on a dynamic data table
Perform Calculations:
oUse sum, average, minimum, maximum and countoShow Percentage of a column total, row total and Grand totaloDisplay the running totaloGroup numeric and date dataoUse calculated field and calculated item
Change The Report Structure
oSwitching columns and rowsoAdding columns or rowsoAdding a page break between items
Format your Pivot Tables
oAdd totals and SubtotalsoSortoFilter
You will also know to
-Add slicers and to manipulate then-Add a timelines and to manipulate it-Add charts to your pivot tables-Use the new and innovative feature: "The Data Model"And, of course, You will learn some cool tips and tricks!